Leaving, crossing, arriving
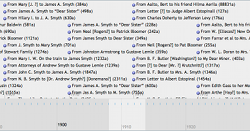
Stories of migration as told through correspondence
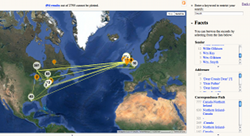
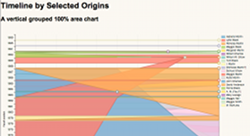
These visualisations were developed for the AHRC funded project, Digitising experiences of migration, in an attempt to demonstrate the possibilities of data visualisation when studying large datasets. The project, led by Hilary Nesi (PI) and Emma Moreton (CI) at Coventry University, brought together academics from both Europe and America.
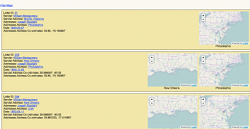
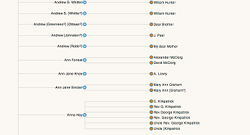
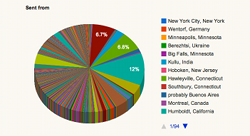
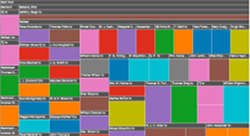
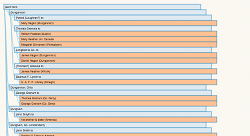
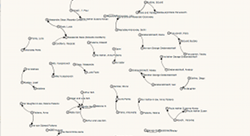
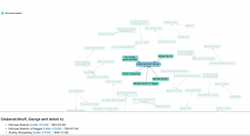
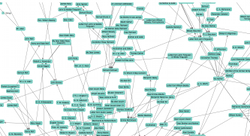
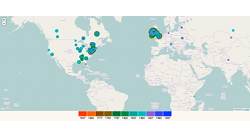
My role was to take TEI files developed by Peter Stadler of Universitat Paderborn and develop ways of exploring this data using online visualisation tools. For the most part, I adapted a selection of third party Javascript visualisations using a range of technologies to gain insights into a variety of migrant letters written over four centuries.
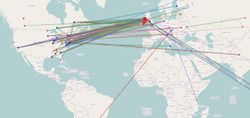
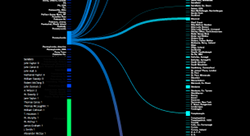
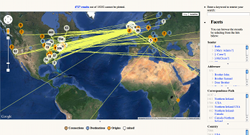
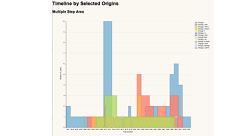
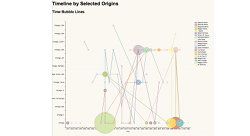
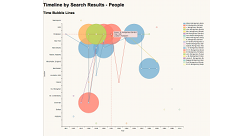
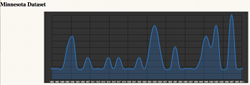
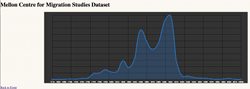
The visualisations use a variety of open-source libraries, including Leaflet, Exhibit, JQuery, D3, Dimple, and Peoplemovin, but have been chosen and tailored specifically for spatial, temporal and personal attributes. The letters data used is drawn from the collections of the Mellon Centre for Migration Studies and the Immigration History Research Center and Archives at the University of Minnesota. More information on these collections can be found on the websites of the Mellon Centre for Migration Studies and the Immigration History Research Center and Archives.